GSP Cloud: fBIRN Analysis
GSP Cloud is Gold Standard Phantoms’ cloud-based image platform for the analysis of MRI data acquired with phantoms. GSP Cloud makes it easy to keep track of routine QA measurements, including the storage/archiving of data, automated analysis pipelines that generate QA metrics for each test, generation of QA reports in PDF format, and the longitudinal graphing of QA metrics, making it easy to identify MRI system performance changes. Multiple users from the same organisation and group can upload data and view results, making it easy to share QA information across research and clinical institutions.
Share
GSP Cloud is completely free to access for anyone to run an fBIRN stability analysis (https://onlinelibrary.wiley.com/doi/full/10.1002/jmri.20583) on a phantom of your choice (be it original fBIRN Agar sphere, GSP’s FUNSTAR phantom or any other phantom of your choice). To sign up, please email info@goldstandardphantoms.com.
With GSP Cloud you can:
- Upload phantom image data in DICOM format, no need to pre-process or convert.
- Automatically identify the types of DICOM data that have been uploaded allowing the execution of QA and stability processing.
- Provides reports of MRI scanner performance metrics from the uploaded data.
- Longitudinally assess and compare key performance metrics such as SNR, measurement values, drift, etc.
- Compare measurements taken across sites and scanners to facilitate multi-centre studies.
Click here to see a demo of GSP Cloud using our FUNSTAR product.
Upload DICOM Data
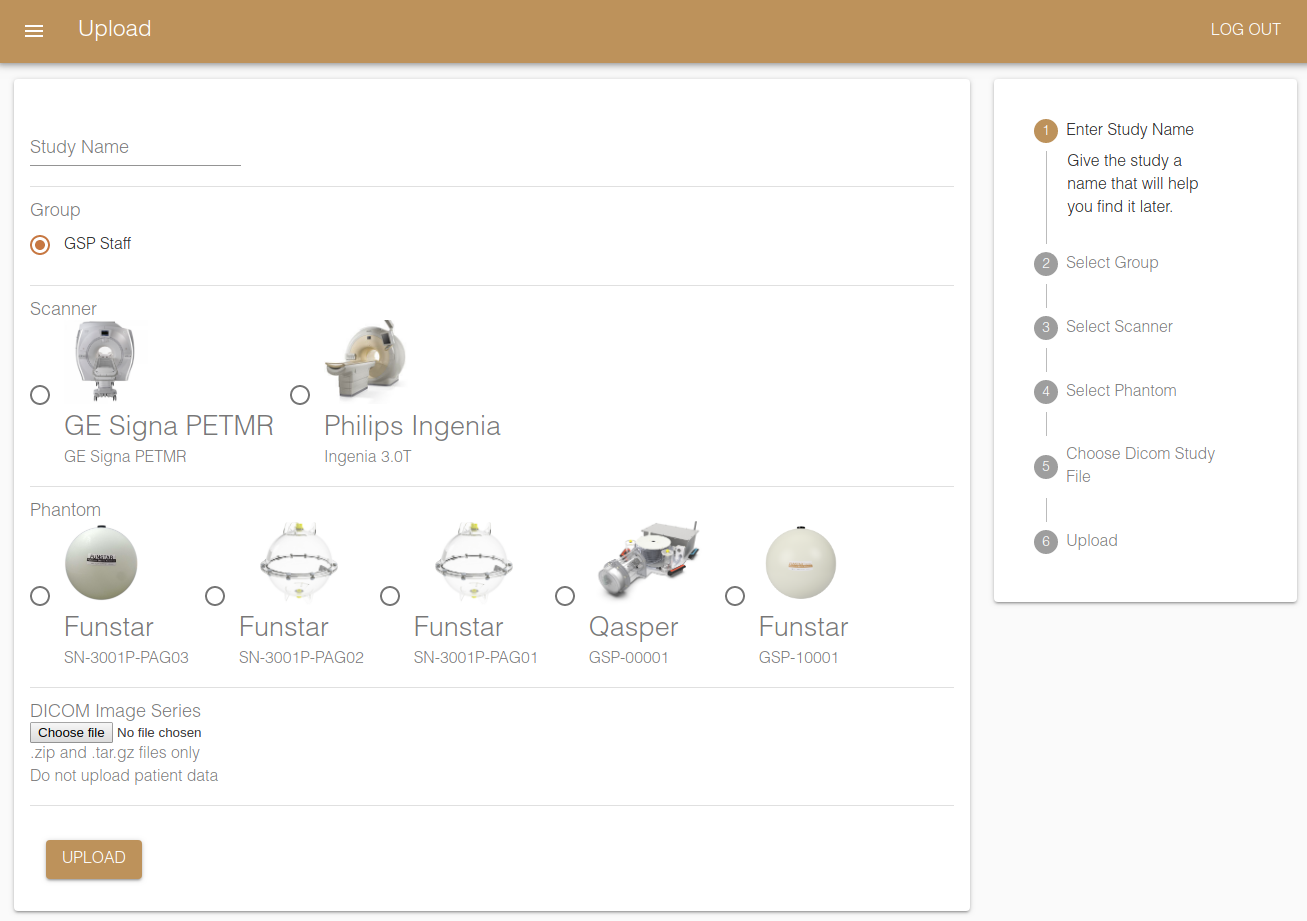
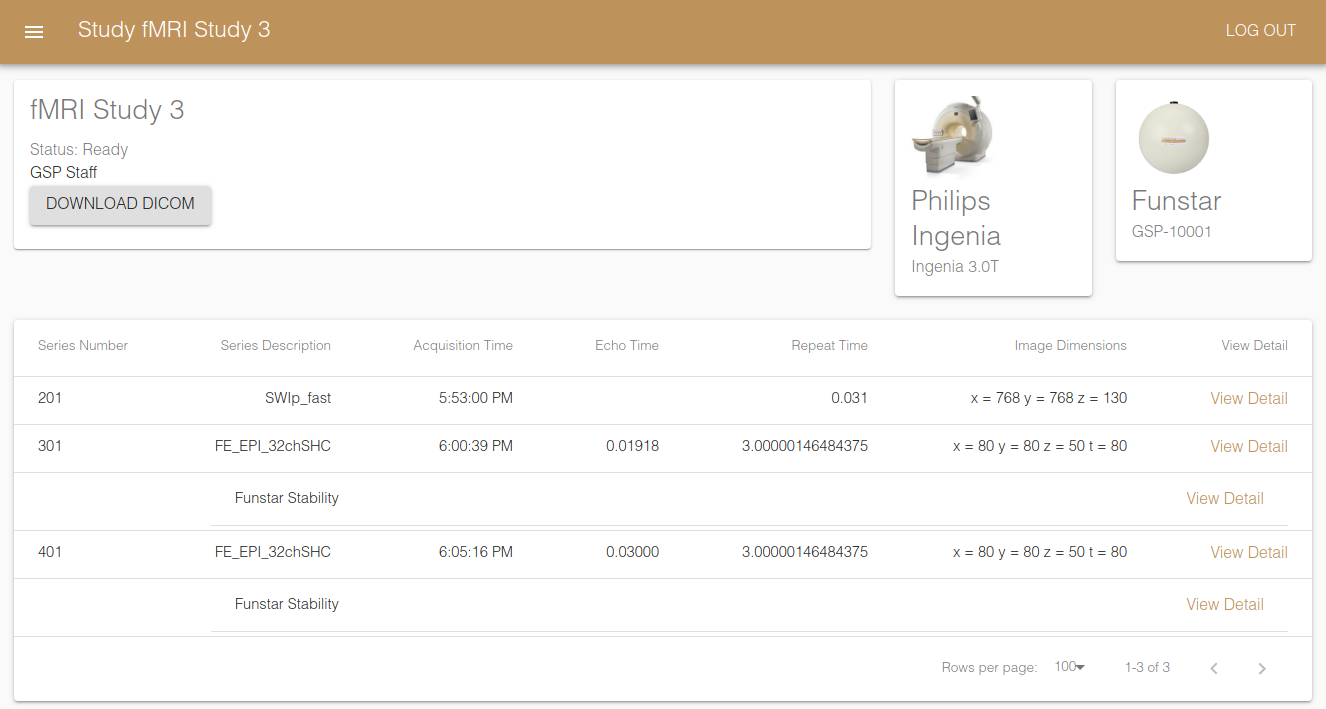
Simply export the DICOM data directly from the MRI scanner and upload as an archive (zip or tar.gz). No need to pre-process or convert to another format. GSP Cloud will automatically identify image series that can be analysed, only requiring confirmation from you on which to process.
Dashboard View
Study View
Automatically Generate QA Reports
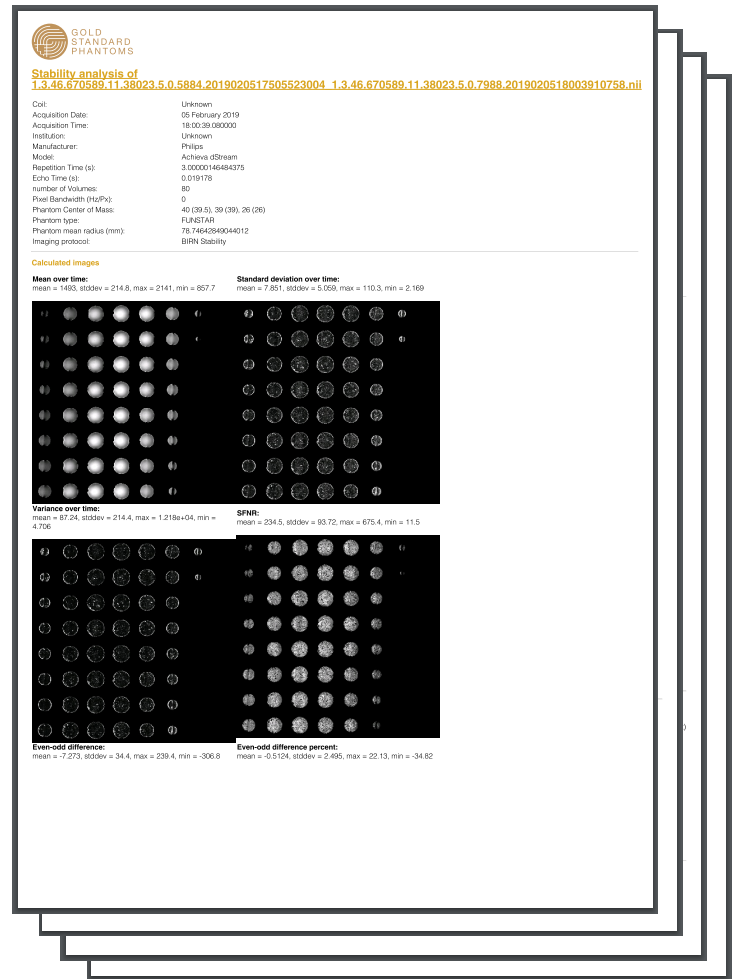
fBIRN QA reports are automatically generated and available to download in PDF format.
View Longitudinal Scanner Performance
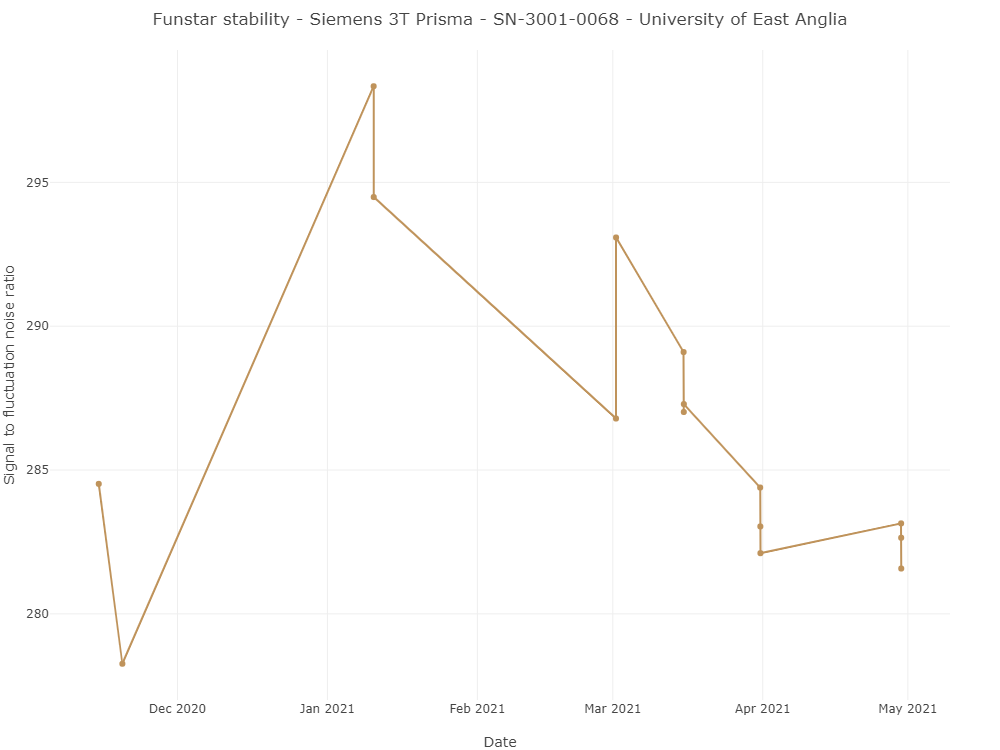
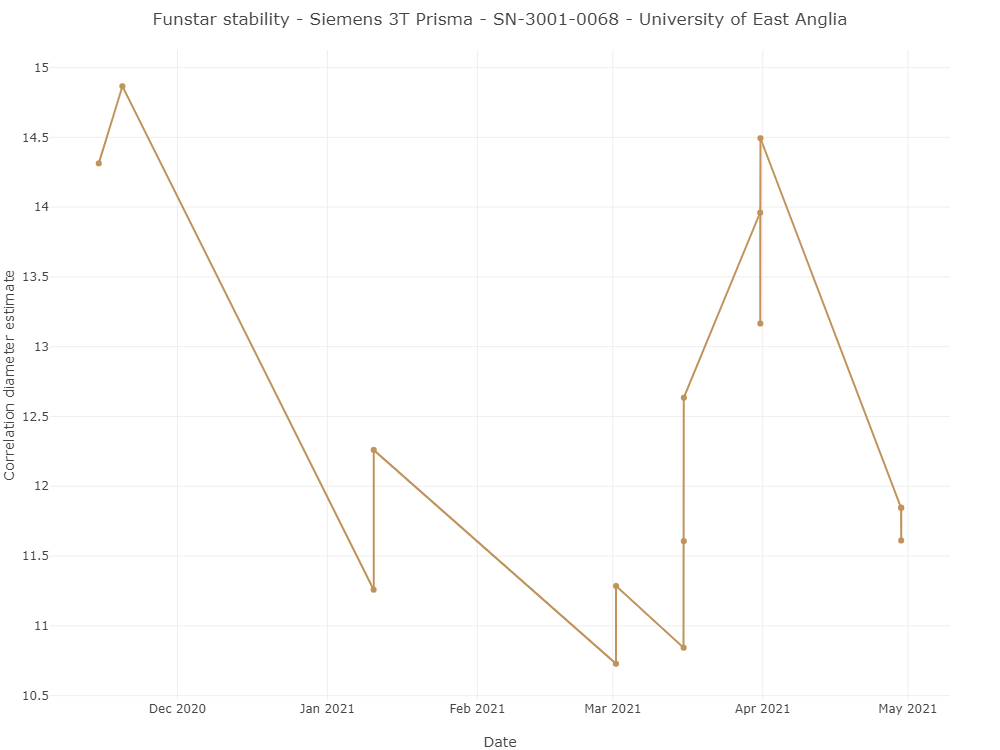
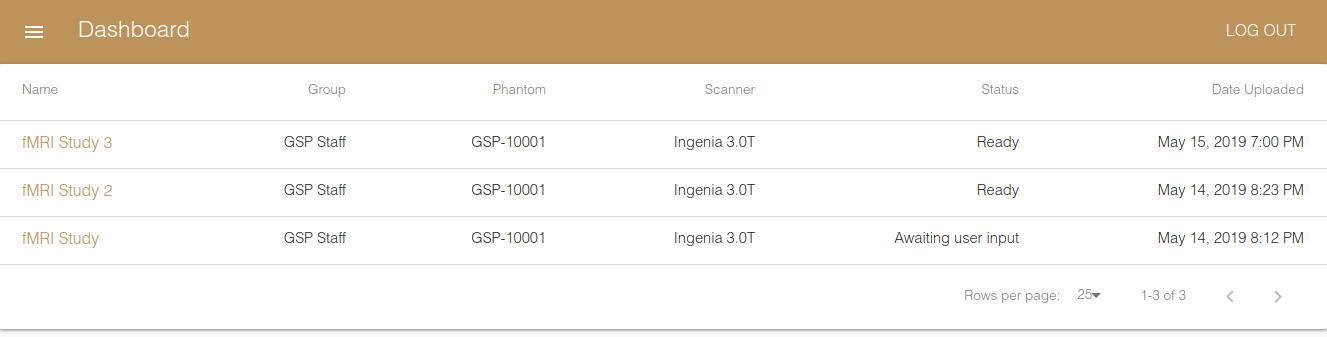
Key performance metrics for the fBIRN analysis can be viewed for each MRI system, and plotted longitudinally:
- RMS Stability
- Correlation diameter estimate
- Imaging frequency
- Mean central ROI value
- Signal to fluctuation noise ratio
- Signal to noise ratio
- Spatial drift